參考文章
下面這張圖,真的會覺得比較明白LOD的真義在哪裡
This is where a LOD expression is handy in creating a fixed comparison measure for 2012 sales.
There are three types of LOD expressions: EXCLUDE, INCLUDE, and FIXED. To create my benchmark for 2012 Sales, I am going to leverage the EXCLUDE expression, which basically means Tableau is going to ignore whichever dimension I put in the expression.
My calculated field using LOD expressions for 2012 sales is:
{EXCLUDE [Order Date]: SUM(IF YEAR([Order Date]) = 2012 THEN Sales END)}
This calculation says, “Regardless of the Order Date dimension, which is currently being used to display one year per row, always show the sum of sales from 2012.”
Note that because I am wanting to ignore the date dimension in this specific example, Order Date is the dimension following the EXCLUDE function. If you are creating a benchmark for something else such as a product category, manager, or test recipe, substitute Order Date with the appropriate dimension for your use case.
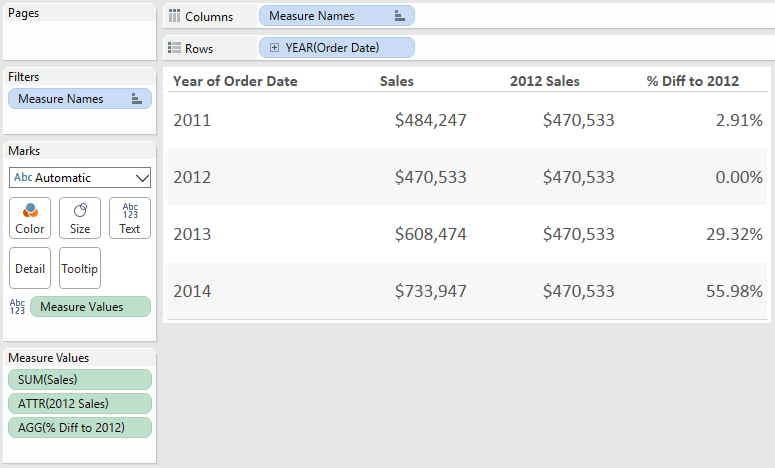
Now my table looks like this:

想要針對全體總值對某一年度的比較 ,就可以用這樣的方式去做。
Now every year displays the 2012 sales amount in the 2012 sales column. Now that the sales for each respective year and the sales for 2012 are on the same row, they can be used for calculations, such as percent growth.
As just one example, I’ll create a calculated field to show percent difference from 2012 sales and place it on the view as a third column. The formula is:
SUM(Sales) / SUM(2012 Sales)-1
Here’s the final view:
另外還有一個網路PDF可以參考:Free eBook: 33 Ways to Tableau
https://www.ryansleeper.com/wp-content/uploads/2018/04/33-Ways-to-Tableau-by-Ryan-Sleeper.pdf
也可以下載來看看。
Views: 75


