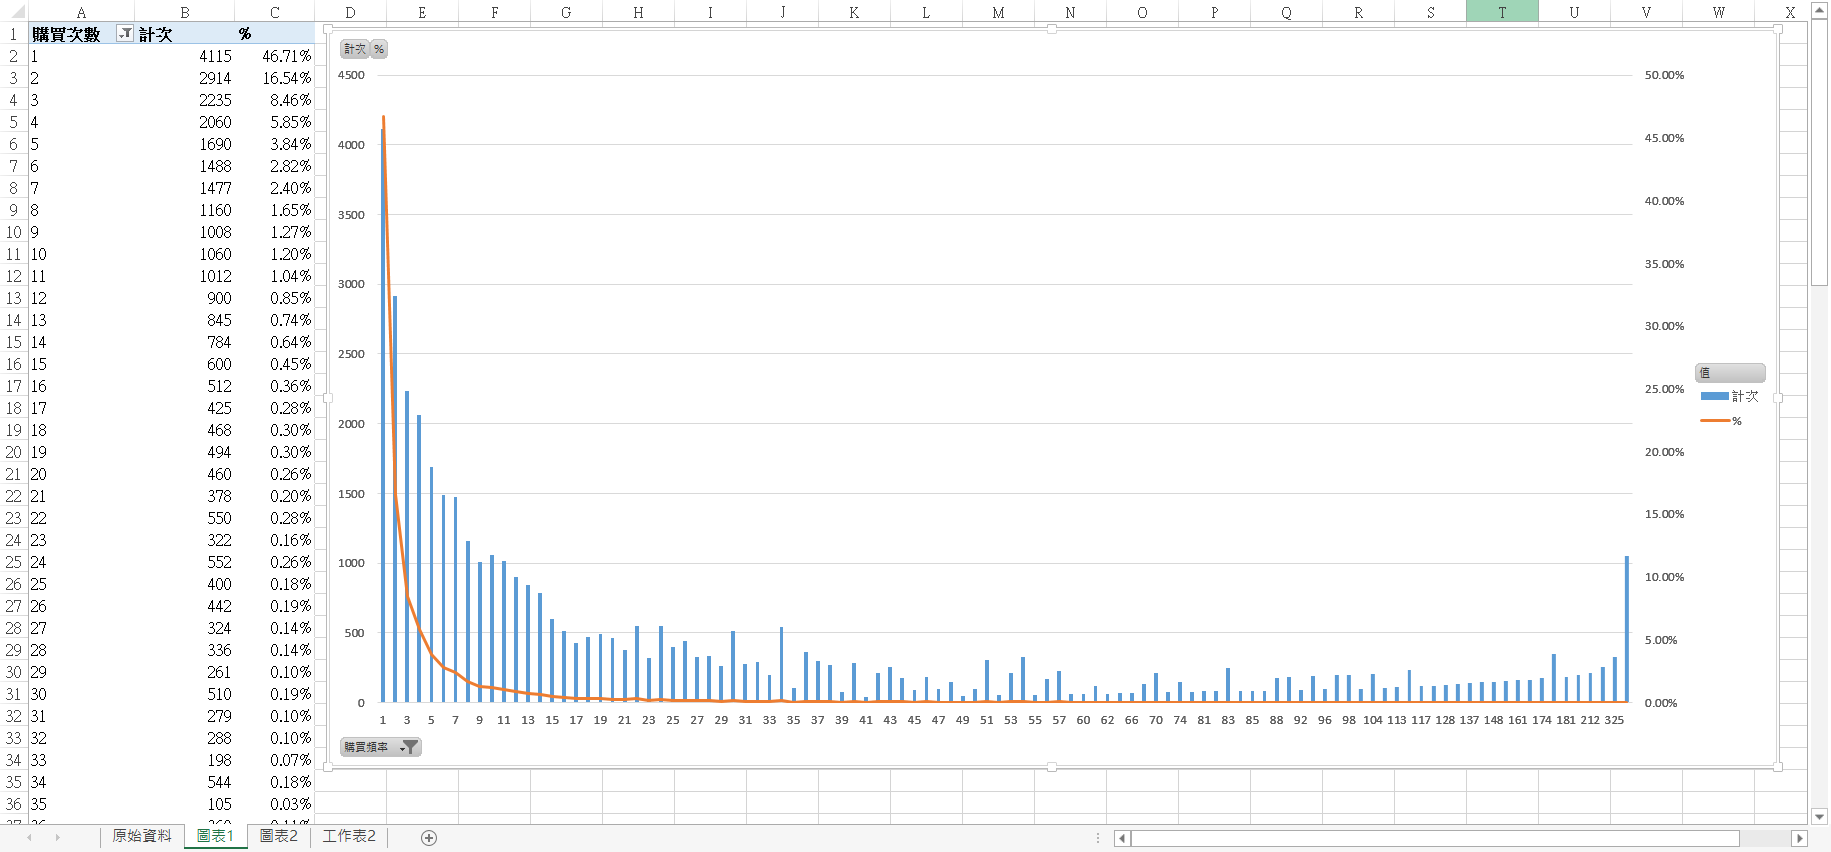
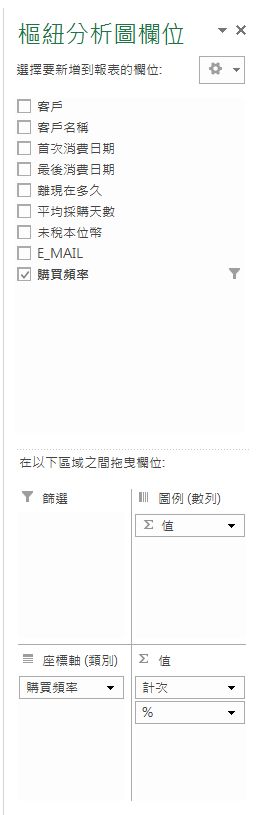
【EXCEL】一個簡單的樞紐分析表計算圖表 View Larger Image 客戶購買頻率計次圖表 四年來購買一次的人數有 4115人 購買兩次的的有2914人 購買三次的有2235人 已此類推。 做這個之前最少要先提供如下面的資料 欄位的地方拉成這樣 Views: 31 By mickey|2021-06-30T15:20:08+08:002019-01-23|一般, 資料分析|0 Comments Share This Story, Choose Your Platform! FacebookTwitterRedditLinkedInWhatsAppTelegramTumblrPinterestVkXingEmail About the Author: mickey Related Posts 數位資產是什麼? Gallery 數位資產是什麼? 【2024】12款免費注音字體下載 Gallery 【2024】12款免費注音字體下載 台北關鍵字廣告|如何做好關鍵字廣告 台北關鍵字廣告|如何做好關鍵字廣告 【VULTR】主機開機時間 Gallery 【VULTR】主機開機時間 Subscribe Notify of new follow-up comments new replies to my comments Label {} [+] Name* Email* Website Label {} [+] Name* Email* Website 0 Comments Oldest Newest Most Voted Inline Feedbacks View all comments